Demographics of Kiribati
Appearance
| Demographics of Kiribati | |
|---|---|
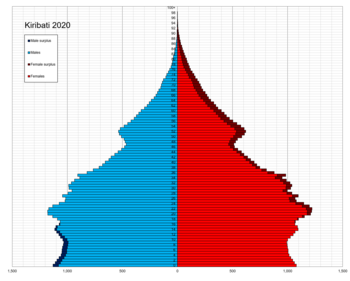
 Kiribati population pyramid in 2020 | |
| Population | 128,874 (2021) |
Demographic features of the population of Kiribati include population density, ethnicity, education level, health of the populace, economic status, religious affiliations and other aspects of the population.
Population
[edit]| Rank | Name | Island | Pop. | ||||||
|---|---|---|---|---|---|---|---|---|---|
 Betio  Bikenibeu |
1 | Betio | South Tarawa | 18,565 |  Teaoraereke  Bairiki | ||||
| 2 | Bikenibeu | South Tarawa | 7,547 | ||||||
| 3 | Teaoraereke | South Tarawa | 6,073 | ||||||
| 4 | Bairiki | South Tarawa | 3,500 | ||||||
| 5 | Temwaiku | South Tarawa | 5,504 | ||||||
| 6 | Eita | South Tarawa | 3,921 | ||||||
| 7 | Tabwakea | Kiritimati | 3,537 | ||||||
| 8 | Bonriki | South Tarawa | 3,075 | ||||||
| 9 | Ambo | South Tarawa | 3,373 | ||||||
| 10 | London | Kiritimati | 1,970 | ||||||
Structure of the population
[edit]Population by Sex and Age Group (Census 07.XI.2015): [3]
| Age Group | Male | Female | Total | % |
|---|---|---|---|---|
| Total | 54 096 | 56 040 | 110 136 | 100 |
| 0–4 | 7 546 | 6 847 | 14 393 | 13.07 |
| 5–9 | 6 903 | 6 697 | 13 600 | 12.35 |
| 10–14 | 5 309 | 5 136 | 10 445 | 9.48 |
| 15–19 | 5 851 | 5 825 | 11 676 | 10.60 |
| 20–24 | 5 199 | 5 120 | 10 319 | 9.37 |
| 25–29 | 4 682 | 4 990 | 9 672 | 8.78 |
| 30–34 | 3 838 | 4 174 | 8 012 | 7.27 |
| 35–39 | 3 161 | 3 423 | 6 584 | 5.98 |
| 40–44 | 2 433 | 2 658 | 5 091 | 4.62 |
| 45–49 | 2 676 | 3 031 | 5 707 | 5.18 |
| 50–54 | 2 372 | 2 533 | 4 905 | 4.45 |
| 55–59 | 1 548 | 1 773 | 3 321 | 3.02 |
| 60–64 | 1 051 | 1 355 | 2 406 | 2.18 |
| 65-69 | 731 | 1 017 | 1 748 | 1.59 |
| 70-74 | 460 | 778 | 1 238 | 1.12 |
| 75-79 | 217 | 391 | 608 | 0.55 |
| 80-84 | 80 | 187 | 267 | 0.24 |
| 85-89 | 30 | 79 | 109 | 0.10 |
| 90-94 | 7 | 17 | 24 | 0.02 |
| 95-99 | 2 | 9 | 11 | 0.01 |
| 100+ | 0 | 0 | 0 | 0 |
| Age group | Male | Female | Total | Percent |
| 0–14 | 19 758 | 18 680 | 38 438 | 34.90 |
| 15–64 | 32 811 | 34 882 | 67 693 | 61.46 |
| 65+ | 1 527 | 2 478 | 4 005 | 3.64 |
Population by Sex and Age Group (Census 07.XI.2020) (Provisional): [3]
| Age Group | Male | Female | Total | % |
|---|---|---|---|---|
| Total | 59 154 | 60 786 | 119 940 | 100 |
| 0–4 | 7 965 | 7 422 | 15 387 | 12.83 |
| 5–9 | 7 517 | 6 895 | 14 412 | 12.02 |
| 10–14 | 6 701 | 6 598 | 13 299 | 11.09 |
| 15–19 | 5 368 | 5 022 | 10 390 | 8.66 |
| 20–24 | 5 629 | 5 520 | 11 149 | 9.30 |
| 25–29 | 4 993 | 5 113 | 10 106 | 8.43 |
| 30–34 | 4 511 | 4 776 | 9 287 | 7.74 |
| 35–39 | 3 791 | 4 086 | 7 877 | 6.57 |
| 40–44 | 2 997 | 3 145 | 6 142 | 5.12 |
| 45–49 | 2 311 | 2 555 | 4 866 | 4.06 |
| 50–54 | 2 413 | 2 802 | 5 215 | 4.35 |
| 55–59 | 1 861 | 2 289 | 4 150 | 3.46 |
| 60–64 | 1 386 | 1 679 | 3 065 | 2.56 |
| 65+ | 1 711 | 2 884 | 4 595 | 3.83 |
| Age group | Male | Female | Total | Percent |
| 0–14 | 22 183 | 20 915 | 43 098 | 35.93 |
| 15–64 | 35 260 | 36 987 | 72 247 | 60.24 |
| 65+ | 1 711 | 2 884 | 4 595 | 3.83 |
Statistics
[edit]| Year | Pop. | ±% |
|---|---|---|
| 1921 | 26,430 | — |
| 1931 | 29,751 | +12.6% |
| 1947 | 31,513 | +5.9% |
| 1963 | 43,336 | +37.5% |
| 1973 | 51,926 | +19.8% |
| 1978 | 56,213 | +8.3% |
| 1985 | 63,883 | +13.6% |
| 1990 | 72,335 | +13.2% |
| 1995 | 77,658 | +7.4% |
| 2000 | 84,494 | +8.8% |
| 2005 | 92,533 | +9.5% |
| 2010 | 103,058 | +11.4% |
| 2015 | 110,136 | +6.9% |
| 2020 | 119,940 | +8.9% |
| Source: [4][5] | ||

The following demographic statistics are from the CIA World Factbook, unless otherwise indicated.[6]
Nationality
[edit]- Noun: I-Kiribati (singular and plural forms)
- Adjective: Kiribati or Gilbertese
Ethnic groups
[edit]- I-Kiribati 96.2%, 105,983
- Mixed/I-Kiribati 1.8% 1,974
- Tuvaluans 0.2% 198
- Others 1.8% 1,981 (2015 census)
Religions
[edit]- Roman Catholic: 57.3%
- Kiribati Uniting Church: 31.3%[7]
- Latter-day Saints: 5.3%
- Baháʼí: 2.1%
- Seventh-day Adventist: 1.9%
- Other: 2.1% (2015 est.)
Languages
[edit]- English (official)
- Gilbertese (official)
Population
[edit]- 110,136 (2015 Census)
- 119,940 (2020 Census)
Age structure
[edit]- 0–14 years: 28.47% (male 16,223, female 15,604)
- 15–24 years: 20.24% (male 11,171, female 11,459)
- 25–54 years: 40.05% (male 21,530, female 23,249)
- 55–64 years: 6.65% (male 3,350, female 4,084)
- 65 years and over: 4.59% (male 2,004, female 3,122) (2015 est.)
From 2015 Census:
- 0–5 years: 17,466
- 6–14 years: 20,962
- 15–17 years: 7,089
- 18–49 years: 49,972
- + 50 years: 14,637
Median age
[edit]- Average: 23.9 years
- Male: 23.1 years
- Female: 24.8 years (2015 est.)
Population growth rate
[edit]- 1.09% (2020 est.)
Birth rate
[edit]- 20.5 births/1,000 population (2020 est.)
Death rate
[edit]- 6.9 deaths/1,000 population (2020 est.)
Net migration rate
[edit]- -2.8 migrant(s)/1,000 population (2020 est.)
Urbanization
[edit]- Urban population: 55.6% of Total population (2020)
- Rate of urbanization: 1.78% annual rate of change (2010—15 est.)
Sex ratio (male(s) to female)
[edit]- At birth: 1.05
- 0–14 years: 1.04
- 15–24 years: 0.97
- 25–54 years: 0.93
- 55–64 years: 0.82
- 65 years and over: 0.64
- Total population: 0.94 (2020 est.)
Maternal mortality rate
[edit]- 90 deaths/100,000 live births (2015 est.)
Infant mortality rate
[edit]- Total: 34.26 deaths/1,000 live births
- Male: 35.48 deaths/1,000 live births
- Female: 32.99 deaths/1,000 live births (2015 est.)
Life expectancy at birth
[edit]- Total population: 67.5 years
- Male: 65 years
- Female: 70.2 years (2020 est.)
Total fertility rate
[edit]- 2.25 children born/woman (2020 est.)
- 3.3 (2018–19) - Pacific community[8]
Health expenditure (% of GDP)
[edit]- 10.8% (2017)
Physicians density
[edit]- 0.2 physicians/1,000 population (2013)
Hospital bed density
[edit]- 1.9 beds/1,000 population (2015)
Obesity – adult prevalence rate
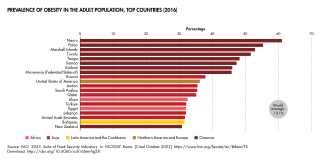
[edit]- 46% (2016)
School life expectancy
[edit]- Male: 11 years
- Female: 12 years (2015 est.)
References
[edit]- ^ "Population and Housing Census" (PDF). National Statistics Office. Kiribati 2015 census of population and housing. Ministry of Finance. 2015. pp. 34–50. Archived from the original (PDF) on 2019-10-29. Retrieved 2020-07-03.
- ^ "Archived copy". Archived from the original on 2021-10-10. Retrieved 2021-02-07.
{{cite web}}: CS1 maint: archived copy as title (link) - ^ a b "UNSD — Demographic and Social Statistics". unstats.un.org. Retrieved 2023-05-10.
- ^ "Census of Population and Housing". Archived from the original on 2015-03-29. Retrieved 2014-07-17.
- ^ "Archived copy" (PDF). Archived from the original (PDF) on September 30, 2013. Retrieved March 17, 2013.
{{cite web}}: CS1 maint: archived copy as title (link) - ^ "Australia-Oceania :: KIRIBATI". CIA The World Factbook. 6 June 2022.
- ^ Since 2014, there are two separate church denominations: the older Kiribati Protestant Church and the new Kiribati Uniting Church.
- ^ "Pacific Island 2020 populations poster = Les populations du Pacifique 2020 | Statistics for Development Division". sdd.spc.int. Retrieved 2022-11-30.
![]() This article incorporates public domain material from The World Factbook. CIA.
This article incorporates public domain material from The World Factbook. CIA.
